Lessons from Livermore's 2022 Energy Consumption Chart
It's not actually about energy but measures heat, and it's not pretty this year.
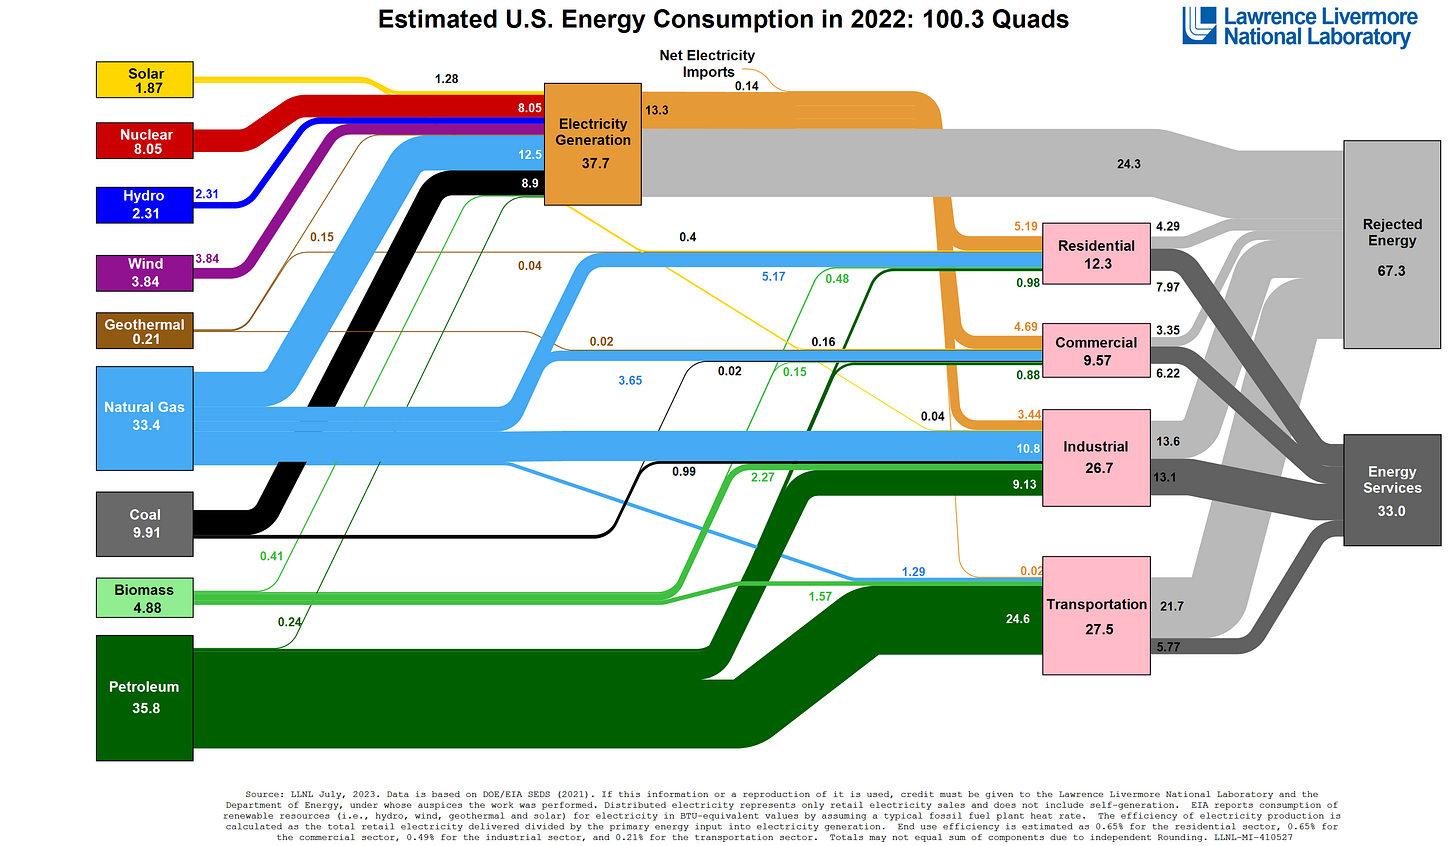
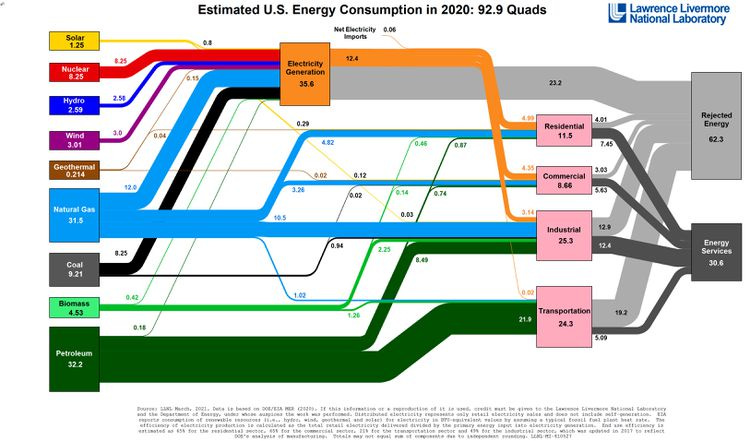
Every year, the Lawrence Livermore National Laboratory (LLNL) updates its energy flow charts, showing where heat comes from and how some of it is converted into useful energy. The 2022 chart is out (rather late, it seems; I usually write about this in April), and it is a bit of a depressing milestone; for the first time since 2019, heat production is greater than 100 quads, returning to pre-pandemic levels.
But wait, you might say, the chart says “energy consumption.” Why am I calling it “heat production?” It’s because a quad stands for a quadrillion BTUs or British Thermal Units, “a measure of the heat content of fuels or energy sources. One BTU is the quantity of heat required to raise the temperature of one pound of liquid water by 1° Fahrenheit (F) at the temperature that water has its greatest density (approximately 39° F). One British thermal unit (Btu) is approximately equal to the energy released by burning a match.” And why are they measuring heat using such an archaic measure? Because until recently, burning stuff was pretty much the only way we got useful energy.
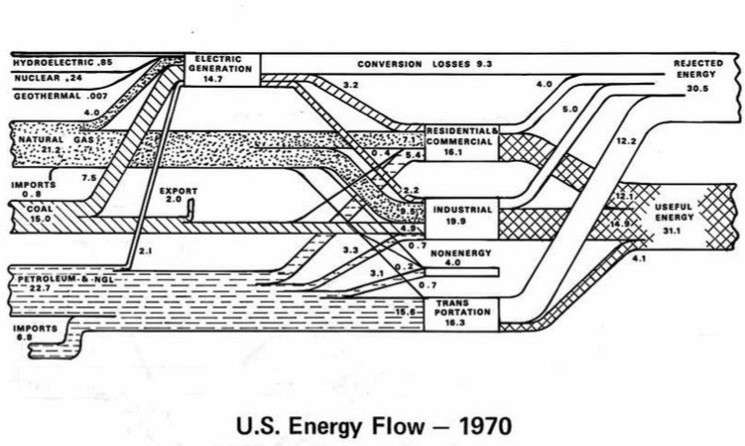
Fifty years ago, they actually called it “useful energy” rather than energy services, and it made a lot more sense. And on both charts, there is what they call (I think inaccurately) “rejected energy.” As Allison Bailes of Energy Vanguard notes, we are using heat to do work; it is the cost of doing business in machines that burn stuff.
“The thing about heat engines, though, is that there’s no way to convert all of the heat energy into usable work. There will always be heat left over. That’s what makes up the bulk of that rejected energy you see above. As it turns out, we’ve known this limitation for nearly 200 years. A French kid named Sadi Carnot figured out that there’s a limit on the efficiency of heat engines. He discovered the thermodynamic cycle that yields the maximum efficiency of a heat engine. His work is so important in thermodynamics that his maximum theoretical efficiency is called the Carnot efficiency.”
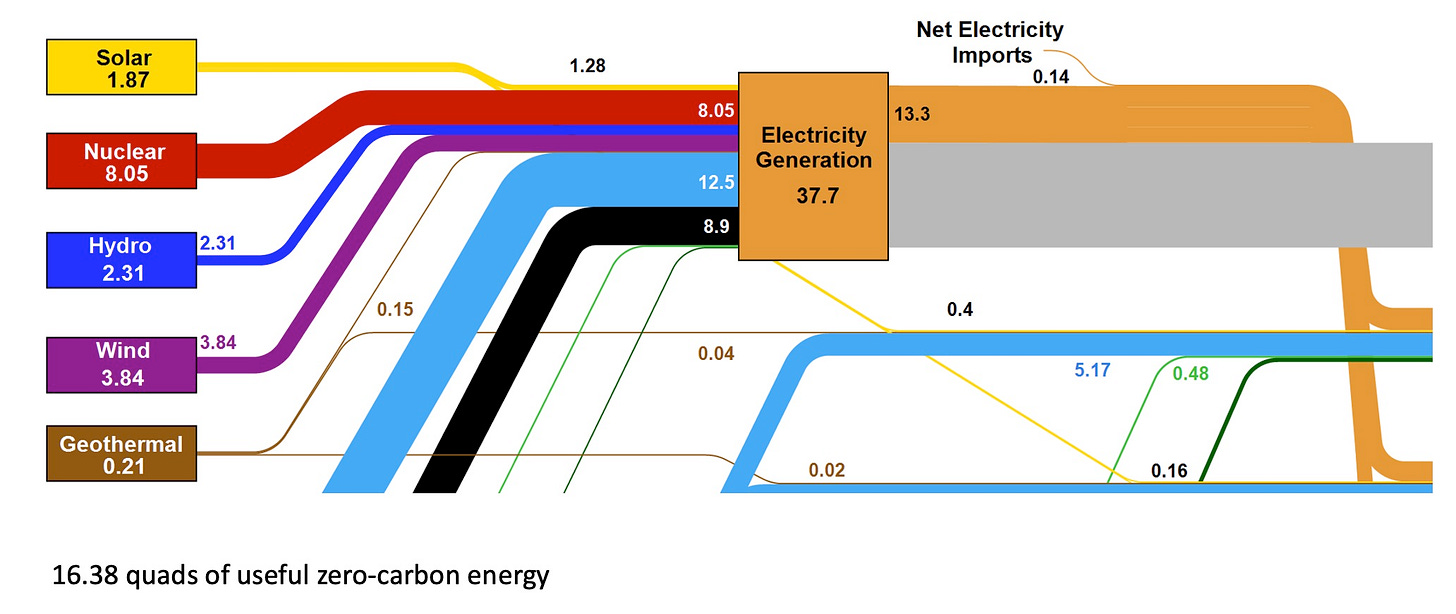
So why are renewables that make useful energy without boiling water or burning gasoline measured in BTUs? According to the small print at the bottom, hydro, wind, and solar are reported in “BTU-equivalent values by assuming a typical fossil fuel plant heat rate.” More weirdness ensues when you consider that a nuclear plant makes electricity the same way a coal plant does, by boiling water and spinning turbines, and “Nuclear and thermal power plants dispose large amounts of waste heat into oceans, rivers, lakes, and air. Based on the heat generated by nuclear reactors, power plants usually have a generation end efficiency of 33–35% and about 60% of waste heat. (source)” Yet somehow, that isn’t listed as “rejected energy” here.
Note also that in 1970, we squeezed 31.1 quads of useful energy out of all those fossil fuels, a larger number than the rejected energy, compared to 31.8 in 2021 and 33 quads in 2022, whereas the rejected energy has doubled. The big difference is cars, in which controlled explosions of gasoline are turned into rotary motion to push 3-ton mobile living rooms carrying 200 pounds of person; no wonder 80% of the heat is lost. Rejected energy from cars has gone up from 12.2 to 21.7. The most inefficient converter of heat has gone up the most.
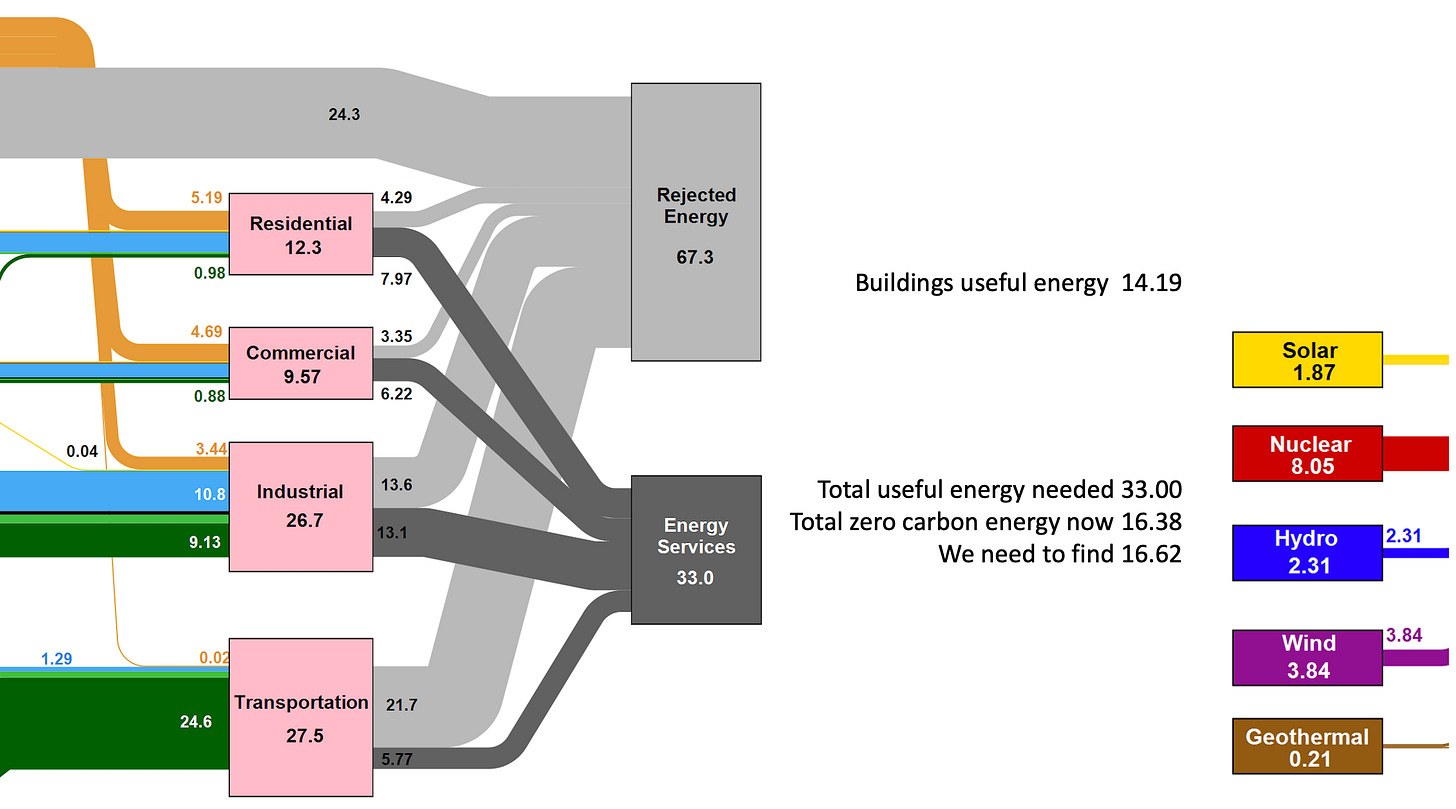
Simplistically, if we just totalled up the useful energy required and met it with zero carbon and renewable sources, we would only need to roughly double the clean energy what we generate now. That doesn’t seem so daunting! Some, like Saul Griffith in this book “Electrify” say we only need 42% of the energy we use now if we subtract all that rejected energy. But it was never on the table; it’s what came out of the power plants that matters, not what went in. It’s the useful energy that matters to us.
Finding another 16 quads of clean energy won’t be so simple either. We are not going to build eight quads of nukes in a hurry, and we have run out of Niagara Falls and Columbia Rivers.
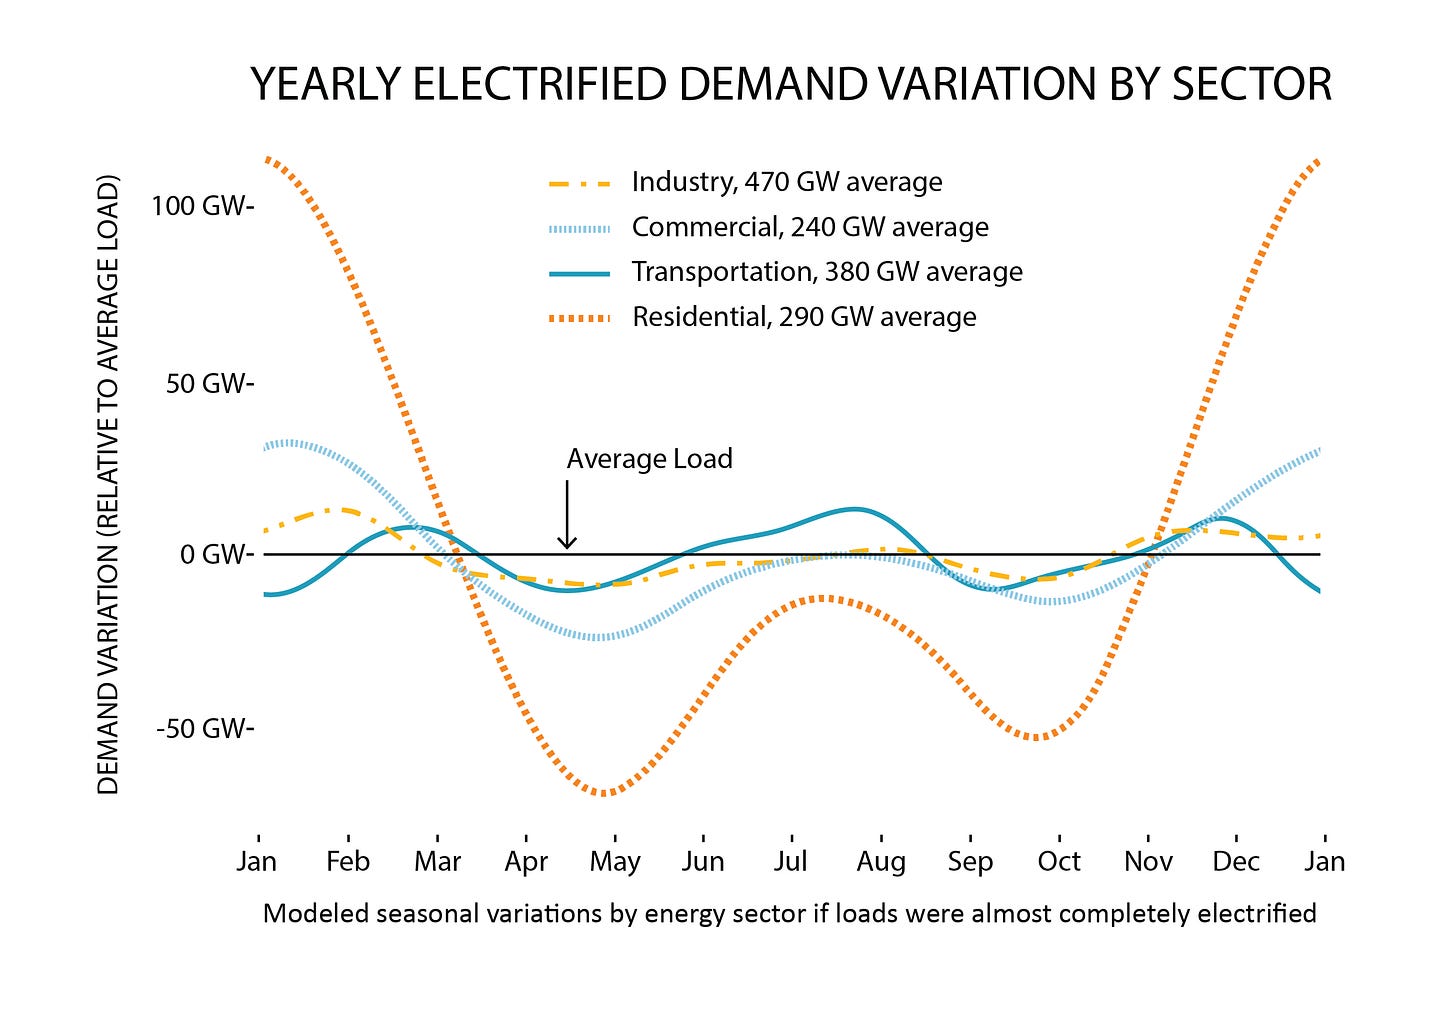
The bigger problem is that demand isn’t nicely spread over the year; demand for heat in buildings peaks in January, when the supply of renewables troughs. A recent study found:
“All of our building electrification scenarios resulted in substantial increases in winter electrical demand, enough to switch the grid from summer to winter peaking. Meeting this peak with renewables would require a 28× increase in January wind generation, or a 303× increase in January solar, with excess generation in other months. Highly efficient building electrification can shrink this winter peak—requiring 4.5× more generation from wind and 36× more from solar.”
Writing in Passive House Accelerator, Skylar Swinford and Zach Semke make the case for improving building energy efficiency (and going Passive House, of course) as the best way of flattening those January wings of electricity consumption. It’s clear that we have to do something besides simply electrifying everything.
Unfortunately, we seem to be going in the wrong direction. When the 2020 chart came out, and consumption was down to 92.9 due to the pandemic, I cheered, noting that the reduction was just about what we had to do every year until 2030 to stay under 1.5 degrees of global heating.
I thought that some of the lessons would stick: driving less and working from home made a big difference in consumption and carbon emissions. I was wrong; 2021 hit 97.3, and now we are back over a hundred.
Comparing 2022 to the previous year, we are generating more quads of heat than ever. Coal consumption has gone down marginally, but gas is way up by 2.1 quads, more than double the .88 quad gain in solar and wind. Nuclear power, which many believe will save us, actually went down. Residential useful energy consumption is up from 7.58 to 7.97, as we build more massively inefficient buildings; it is one number that I would have thought might go down as codes got tighter and Passive House took over the world (not).
But even if every house in America were suddenly heatpumpified, it wouldn’t make a huge difference, with only 5.19 quads of gas delivering .88 quads of useful energy. Over twice as much gas is going into making electricity, which is why we still need to increase efficiency.
The real kicker is transportation, with inefficient cars burning up 24.6 quads of heat to produce 5.77 quads of movement. Followed by industry, about half of which goes to steel, concrete and refining to make and move those cars, all needed to drive around cities that were designed around cars.
The “electrify everything” brigade looks at the Livermore charts and concludes that we will only need a fraction of the energy we use now and will enjoy the “Same–sized homes. Same–sized cars. Same levels of comfort. Just electric.“ But were are not consuming less useful energy by going electric; we are just using less heat. That’s why it’s measured in BTUs.
I look at the Livermore chart and conclude that if we are going to have a hope of electrifying everything, then we need to use a lot less of the stuff. Smaller homes closer together. E-bikes instead of e-cars.
Fossil fuels are incredibly concentrated sources of heat; we could be profligate in our use of them to boil water or push three-ton cars. It will be much harder when we are not burning stuff.




That rascal Jevon and his "Paradox"
"Nuclear power, which many believe will save us, actually went down."
Whose fault is that? Yep—the idealistic anti-nuclear greenies who think that 24/7 ~92% CoE nuclear power is "too expensive" and would rather overbuild wind and solar but have neither the (a) control of when the wind blows or sun shines or (b) infrastructure to integrate all of that. If the climate crisis were of such human survivability importance that we are being demanded to spend $100+ TRILLION on an entire rework of our energy systems, because CO2 is that big of a boogeyman, then streamline the design, permitting, and production of nuclear powered generators—and all without having to stress about "rejected heat."